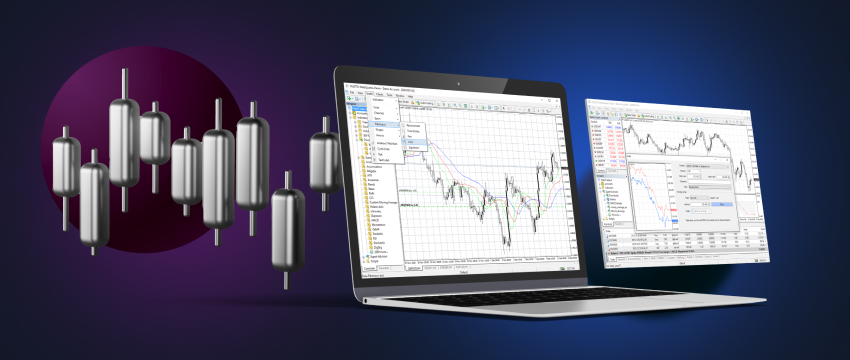
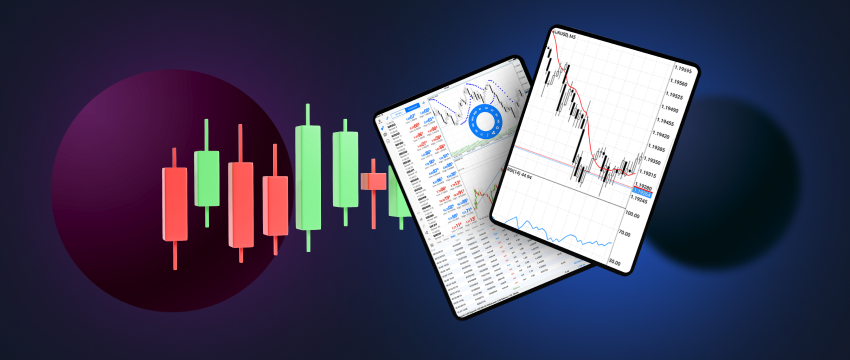
Technical indicators are tools used by traders to analyse financial markets and make informed trading decisions. Technical indicators are used to analyse the price movement of assets over a specific period to identify patterns and trends. These indicators use mathematical formulas to create visual representations of the market (charts, graphs, etc) and other data relevant to trading. The formulas consider information like open and closing prices and trade volume to predict the direction in which a financial instrument is moving.

Why are technical indicators popular?
Technical indicators can help a trader to identify potential opportunities in the financial market. They can also provide crucial insights into when to open or close a trade.
Popular technical indicators
There are many different types of technical indicators, each with its own unique features. Let’s look at some of the most popular:
Momentum indicators
Momentum indicators are used to measure the strength or weakness of stock prices. The rate of change of prices is measured instead of actual price changes. This form of technical analysis compares a current price to what it was in a specific period in the past. A momentum indicator is said to be negative if the most recent price of an asset is lower than what it was before. In contrast, if the recent price is higher, then the momentum indicator is said to be positive. Furthermore, prices are said to be rising if the momentum indicator exceeds a zero value whereas prices are speculated to be falling if the value falls below zero.
Momentum is considered an unbound oscillator, i.e., no upper or lower boundary. Other features of oscillators:
- Oscillators measure momentum. They are used when a clear trend in particular stock prices cannot be identified.
- Oscillators usually move between 2 bands (high and low), indicating if an asset has been overbought or oversold.
- Technical analysts usually combine oscillators with other technical analysis tools before entering or exiting a trade.
- Some of the most common oscillators used by traders include Stochastic oscillators, Relative strength (RSI), Rate of change (ROC) and Money flow (MFI).
Support and resistance levels
Support and resistance levels are used to identify a surplus of buyers (support) or a surplus of sellers (resistance) in the market. It is based on the notion of prices fluctuating because of supply and demand.
Support:
When supply exceeds demand, prices drop which suggests a downtrend. Falling prices may appeal to traders seeking to open a position. When demand begins rising, however, to reach an equilibrium to supply, prices stop dropping. This is called support which on a price chart, is visually demonstrated by an area or zone.
Resistance:
When demand exceeds supply, prices increase, sometimes to a point that selling engulfs the desire to buy. As prices increase further, there will come a point when buying will slow down. This is because prices are considered too high or because traders have met their trading objectives. This resistance (where supply exceeds demand) is represented by a level or zone on a price chart.
Both support and resistance can be found in different charting time frames (e.g., 1-minute, 5-minute, daily, weekly, etc).
Volatility indicators
Trading in the forex market is highly volatile, with unanticipated price fluctuations a common occurrence. This volatility can be measured using historical data and forecasting upcoming price movements. Volatility indicators measure the degree of price fluctuations or volatility, helping traders to make more informed trading decisions. They are also used to identify the level of risk or uncertainty associated with a particular asset or market. Volatility indicators can also be used to help identify the strength of a trend or whether a market is about to reverse. Volatility indicators include Bollinger bands, Average true range, Keltner channel, Parabolic stop and reverse and Volatility squeeze.

Moving-average indicator
Traders use moving average indicators to identify price trends in the market by levelling price data over a specific period. This can help traders identify the direction of the trend using historic prices as a reference. A trader may also use periods of different lengths to measure moving averages. A rising moving average suggests that a particular security is in an uptrend. In contrast, a falling moving average indicates that an instrument is in a downtrend.
Two types of moving average indicators are Simple Moving Averages (SMA) and Exponential Moving averages (EMA). The primary difference between the two is how they weigh data points over time. While SMA averages price data over a period, assigning each price equal weight, EMA gives more weight to recent prices. As a result, EMA is more responsive to price changes than SMA.
What is the role of a technical analyst?
A technical analyst uses technical analysis to identify potential trading opportunities and to make informed trading decisions.
- They analyse price fluctuations and market trends.
- They study charts and use different technical indicators to identify patterns in price movements.
- A technical analyst will refer to historical price data and charts to identify potential support and resistance levels, trendlines, and other patterns to speculate future price movements.
- Technical analysts use a short-term approach, analysing charts over the course of minutes, hours, or days.
- They may also combine technical analysis and fundamental analysis to get a comprehensive understanding of the market.
What traders use technical analysis?
Technical analysis is mostly used by day traders and forex scalpers. Swing traders typically make use of technical analysis but will turn to fundamental analysis if the need arises. Position traders will commonly use both technical and fundamental analysis.
Open a demo account to practice technical analysis.
Opening a demo trading offers several benefits to new and experienced traders. It allows you to practice trading in a simulated trading environment, without risking any of your own money. Traders can use a demo account to learn how to use technical analysis before placing real-time, live trades. They can also test different trading strategies in real market conditions for potential outcomes. A demo trading account also offers access to real-time market data, which can help a trader to stay up-to-date with market trends and make informed trading decisions.

Trading with T4Trade
T4Trade is a powerful global broker that is widely recognised for its expertise in trading and high-quality customer support. T4Trade’s MT4 platform offers almost all the trading tools needed to become a more strategic trader. The Học viện T4Trade comprises innovative webinars, videos-on-demand, and podcasts, delivering useful trading tips and market insights to boost your knowledge. Informative blogs and FAQ pages further enhance the learning experience.
Disclaimer: This material is for general informational & educational purposes only and should not be considered investment advice or an investment recommendation. T4Trade is not responsible for any data provided by third parties referenced or hyperlinked, in this communication.


